Key Takeaways
- Two creatives can share the same average score and still be completely different creatives.
- Ellie now returns, second by second and emotion by emotion, how many people were measured, how many reacted, how strongly, and the average.
- Ask for it with one prompt, using the exact project name.
- Use it before you spend: to cut a shorter version, to question a strong (or flat) average, and to see who the creative moved.
What does an average score hide?
Picture two creatives with the same average happiness score at their peak moment.
In the first, almost everyone smiled a little. In the second, a small group lit up and everyone else sat still.
Same number. Two very different creatives. One has broad, gentle appeal. The other has a moment that lands hard with some people and leaves the rest cold. Which one you want depends on the job the creative has to do, but you can't choose if the score hides the difference.
What does Ellie's respondent-level biometrics skill do?
Ellie is your decision partner for marketing. Her newest skill opens up the average.
Name a project you have tested with us. For every second of the creative, and for every emotion we measure, Ellie returns four things:
- How many people were measured at that second.
- How many of them reacted.
- How strongly they reacted.
- The average, so you can see it next to the other three.
It's built from individual respondents, each one anonymised. You see the shape of the audience's response: how wide it was, and how deep.
How do you ask Ellie for it?
Type this into Claude, ChatGPT, Gemini Enterprise or any other MCP-enabled AI tool, wherever you use Ellie:
Ask Ellie for the respondent level biometrics for project [project name].
- Use the exact project name. Not sure what it is? Ask Ellie for your list of projects first.
- Start a new chat for each project.
- Nothing back? Check the project name matches your list exactly, then try again in a new chat.
What comes back?
Because Ellie works inside the AI tool you already use, you can ask that tool to chart the results for you straight away.
Three ways to use it before you spend
1. Find the moments that carry the whole audience. Planning a shorter cut? Look for the seconds where most people reacted, not just the seconds with the highest average. Build the short version around those.
2. Question a strong average, and a flat one. A strong average might rest on a handful of people. A flat one might hide a group who loved it. Either way, you want to know before the budget goes out.
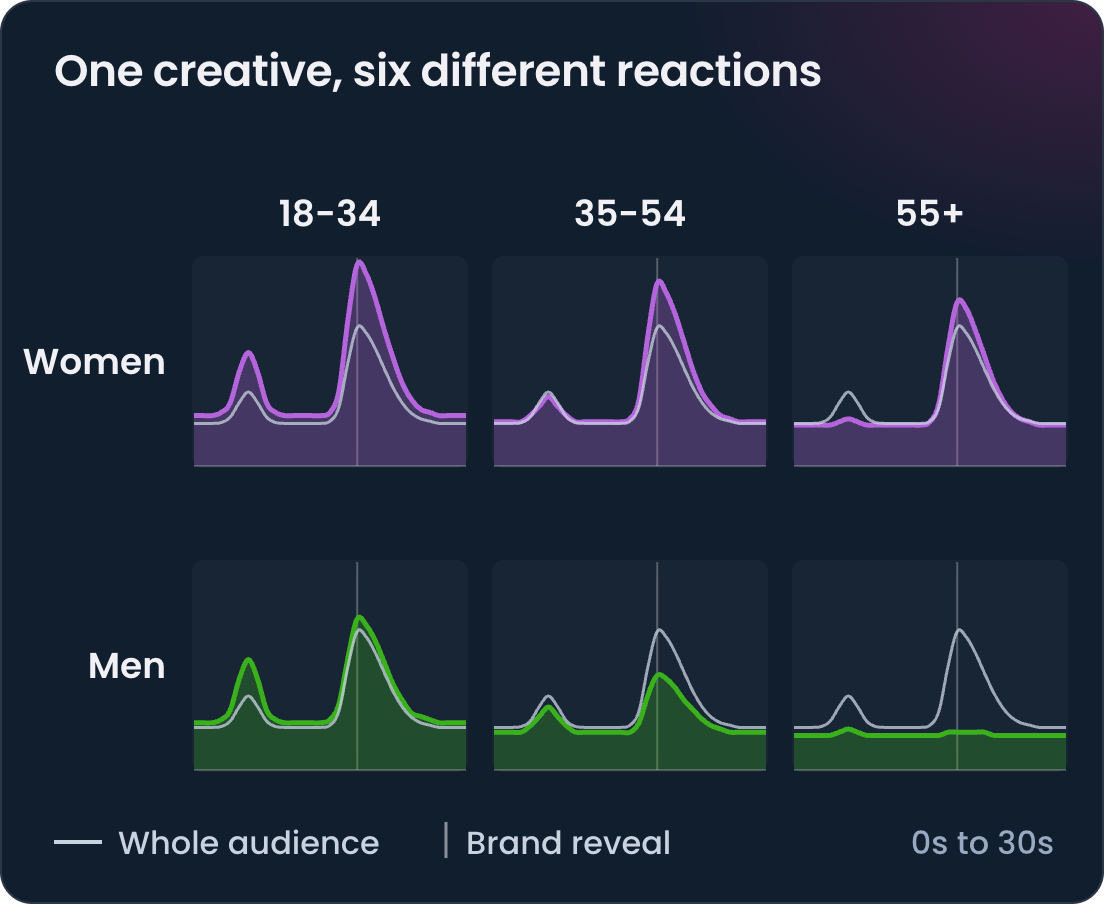
3. See who it moved. You can see the same view for women and men, and for any age group you choose, and set each group against the whole audience. The chart below uses three age bands as an example: 18 to 34, 35 to 54, and 55 and over. Ask for one group at a time by adding it to the end of the prompt, for example "for women only" or "for the 18-34 age group only".
Get onboarded
Ellie is your decision partner for marketing. She works inside Claude, ChatGPT, Gemini Enterprise or any other MCP-enabled AI tool, on top of the creatives you've already tested with us. If your team isn't using her yet, we'll get you set up.
Get onboarded